
Hyderabad: Across 123 urban local bodies (ULB) that went to polls in Telangana on February 13, results were declared in 2,995 of 2,996 wards, leaving one ward pending. The majority mark stood at 1,498. What emerges is a verdict defined by arithmetic — not just who won, but how efficiently they converted contests and who now constitutes urban local governance.
Ward arithmetic: One party above halfway
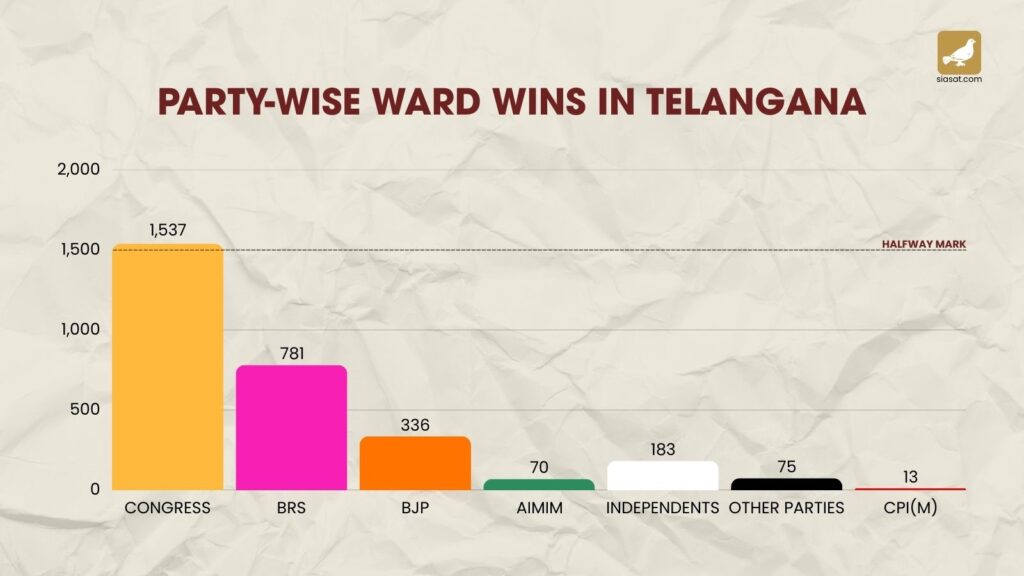
Out of 2,995 declared wards:
Indian National Congress (INC) – 1,537 (51.3 per cent)

Bharat Rashtra Samithi (BRS) – 781 (26 per cent)
Bharatiya Janata Party (BJP) – 336 (11.2 per cent)
All India Majlis-e-Ittehadul Muslimeen (AIMIM) – 70 (2.3 per cent)

Independents – 183 (6.1 per cent)
Other registered parties (TSEC) – 73
Communist Party of India (Mraxist) (CPI(M)) – 13
Bahujan Samaj Party (BSP) – 2
Telugu Desam Party (TDP) – 0
Janasena Party (JSP) – 0
Congress alone crossed the majority mark with 1,537 seats, accounting for just over half of all declared wards. The BRS secured roughly half of Congress’ tally, while the BJP remained in low digits. Regional players TDP and JSP failed to open their accounts despite contesting multiple wards.
The numerical gap is decisive: Congress leads BRS by 756 wards and BJP by 1,201. Even the combined strength of BRS and BJP (1,117) falls 420 short of the Congress’ tally.

Contested vs won: Where the gap opened
While major parties contested almost the entire state, conversion rates defined the outcome.
Congress contested 2,992 wards and converted 51.3 per cent into victories. BRS contested 2,989 but secured only 26.1 per cent. BJP, with 2,870 contests, managed an 11.7 per cent strike rate.
The AIMIM, though geographically limited, stood out for efficiency — winning 70 of 146 contested wards, a 47.9 per cent strike rate.
Independents flooded the ballot with 2,174 contests, but won just 183 seats, an 8.4 per cent success rate.

Among smaller parties:
Other registered parties: 73 wins from 406 contests (18 per cent)
CPI(M): 13 from 111 (11.7 per cent)
BSP: 2 from 94 (2.1 per cent)
TDP: 0 from 182
JSP: 0 from 84
The spread of the contest was similar at the top. The difference lay in conversion.
The social profile of the 2,995 elected members
Beyond party tallies, the demographic composition adds another layer.

Gender
Women now form the majority in urban wards:
Women – 1,638 (54.7 per cent)
Men – 1,356 (45.3 per cent)
Others – 1
Women outnumber men by 282 seats statewide.
Social category

Backward Classes (BC) dominate the elected pool:
BC – 1,661 (55.4 per cent)
Scheduled Castes (SC) – 553 (18.5 per cent)
Scheduled Tribes (ST) – 219 (7.3 per cent)
SC and ST representatives together account for 772 seats, or 25.8 per cent of the total elected members.
Education
The educational profile reflects diversity rather than uniformity.

Undergraduates – 1,254 (41.9 per cent)
Graduates – 476 (15.9 per cent)
Post Graduates – 194 (6.5 per cent)
Doctorates – 4
Illiterate – 334 (11.2 per cent)
Not specified – 733
Nearly two-thirds of elected representatives have at least an undergraduate-level education, though over one in nine are illiterate.
Little difference in vote share of Congress, BRS
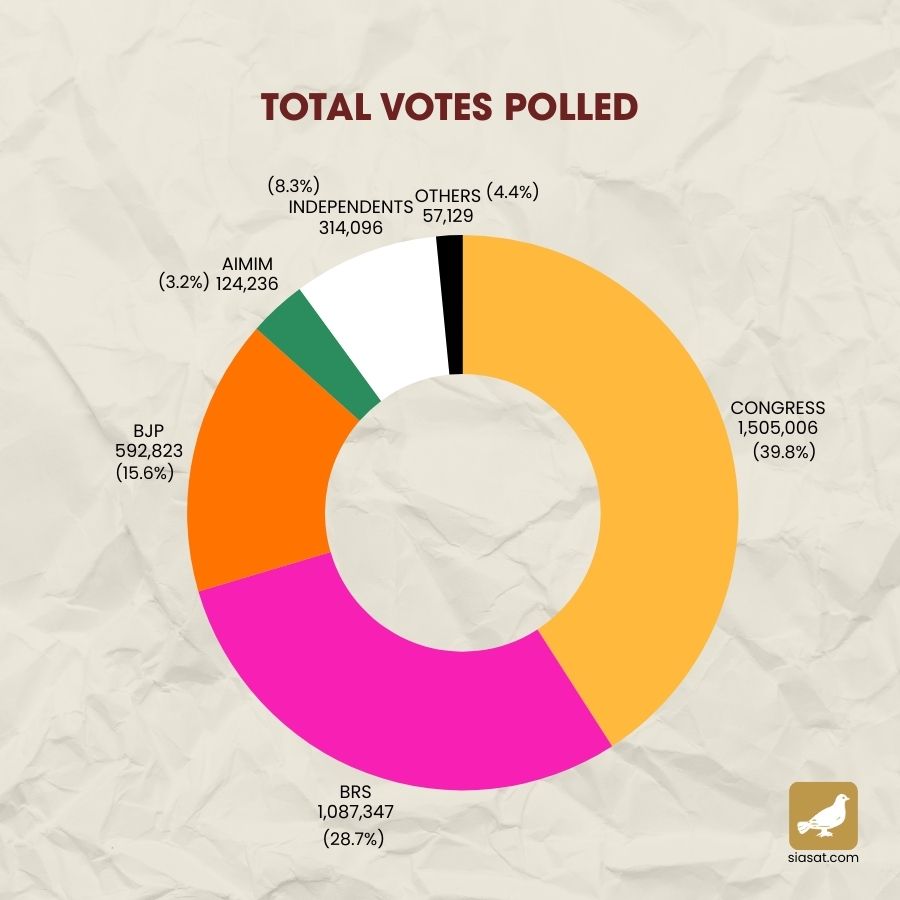
BRS – 28.76 per cent
BJP – 15.68 per cent
AIMIM – 3.28 per cent
Independent candidates – 8.30 per cent
CPM – 0.53 per cent
JSP – 0.35 per cent